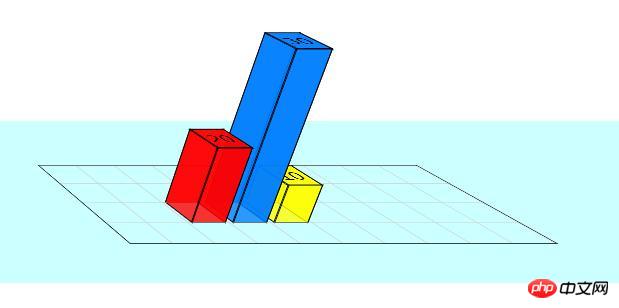
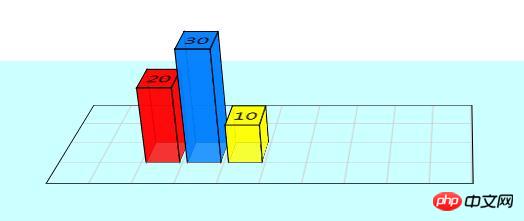
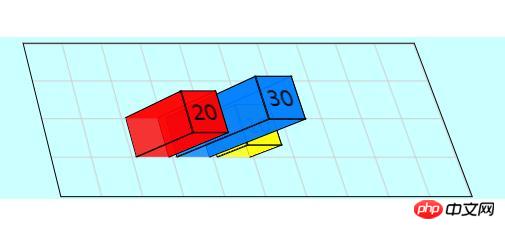
本文介绍的创建立体条形图的示例,使用了透视和旋转的3D效果,而不仅仅是倾斜变换。 结果是一个图表,可以从任何方向查看。
下面我们来一步一步介绍如何建立,示例代码在WebKit浏览器中效果最好,在Firefox(v13)中也相当不错。
1、设置网格
首先设置一个#stage元素,我们可以在其中定义将要查看任何3D转换的透视图 。 基本上是查看器与平面屏幕相关的位置。然后,因为我们正在创建图形,我们需要设置轴和网格(#chart)。
虽然我们可以轻松地创建背景图像并将其平铺以形成网格图案,但我们决定使用CSS 线性渐变语法。在下面的所有代码中,-moz- styles只复制 -webkit-样式。
<style type="text/css"> #stage { -webkit-perspective: 1200px; -webkit-perspective-origin: 0% 0%; -moz-perspective: 1200px; -moz-perspective-origin: 0% 0%; background: rgba(0,255,255,0.2); } #chart { position: relative; margin: 10em auto; width: 400px; height: 160px; border: 1px solid #000; background: -webkit-repeating-linear-gradient(left, rgba(0,0,0,0) 0, rgba(0,0,0,0) 38px, #ccc 40px), -webkit-repeating-linear-gradient(bottom, rgba(0,0,0,0), rgba(0,0,0,0) 38px, #ccc 40px); background: -moz-repeating-linear-gradient(left, rgba(0,0,0,0) 0, rgba(0,0,0,0) 38px, #ccc 40px), -moz-repeating-linear-gradient(bottom, rgba(0,0,0,0), rgba(0,0,0,0) 38px, #ccc 40px); -webkit-transform-origin: 50% 50%; -webkit-transform: rotateX(65deg); -webkit-transform-style: preserve-3d; -moz-transform-origin: 50% 50%; -moz-transform: rotateX(65deg); -moz-transform-style: preserve-3d; } </style>
图表大小为400 x 160像素,网格为40像素。如您所见,背景网格由两个水平和垂直运行的重复渐变组成。图表已从屏幕倾斜65度。
2、定义3D条形图
图表中的每个条形图都由四个边和一个帽组成。这里的样式是针对条形 CSS类,然后可以在不同的位置和颜色中多次使用。它们在HTML中定义,您很快就会看到。
要想象正在应用的变换,请考虑页面上的垂直十字平面。然后将四个侧面旋转离开我们以形成柱子。简单。
<style type="text/css"> .bar { position: absolute; bottom: 40px; margin: 0 4px; width: 32px; height: 40px; outline: 1px solid #000; text-align: center; line-height: 40px; -webkit-transform-style: preserve-3d; -moz-transform-style: preserve-3d; font-size: 20px; } .barfront, .barback, .barleft, .barright { position: absolute; outline: inherit; background: inherit; } .barfront { width: inherit; bottom: 0; -webkit-transform: rotateX(90deg); -webkit-transform-origin: 50% 100%; -moz-transform: rotateX(90deg); -moz-transform-origin: 50% 100%; } .barback { width: inherit; top: 0; -webkit-transform: rotateX(-90deg); -webkit-transform-origin: 50% 0; -moz-transform: rotateX(-90deg); -moz-transform-origin: 50% 0; } .barright { height: inherit; right: 0; -webkit-transform: rotateY(-90deg); -webkit-transform-origin: 100% 50%; -moz-transform: rotateY(-90deg); -moz-transform-origin: 100% 50%; } .barleft { height: inherit; left: 0; -webkit-transform: rotateY(90deg); -webkit-transform-origin: 0% 50%; -moz-transform: rotateY(90deg); -moz-transform-origin: 0% 50%; } </style>
在CSS代码中,我们没有定义图表中条形图的位置或颜色。这需要为每个元素单独完成。但请注意,我们在可能的情况下使用了inherit属性来简化这一过程。
3、条形图HTML标记
在这里,您可以看到实践中用于下面演示的代码。图表上有三个条形图。每个酒吧都是一个div,有四个孩子div组成四边。您可以拥有任意数量的条形图并将它们放置在图表上的任何位置。
<div id="stage"> <div id="chart"> <div class="bar" style="left: 80px; background: rgba(255,0,0,0.8); -webkit-transform: translateZ(80px); -moz-transform: translateZ(80px);"> <div class="barfront" style="height: 80px;"></div> <div class="barback" style="height: 80px;"></div> <div class="barright" style="width: 80px;"></div> <div class="barleft" style="width: 80px;"></div> 20 </div> <div class="bar" style="left: 120px; background: rgba(0,127,255,0.8); -webkit-transform: translateZ(120px); -moz-transform: translateZ(120px);"> <div class="barfront" style="height: 120px;"></div> <div class="barback" style="height: 120px;"></div> <div class="barright" style="width: 120px;"></div> <div class="barleft" style="width: 120px;"></div> 30 </div> <div class="bar" style="left: 160px; background: rgba(255,255,0,0.8); -webkit-transform: translateZ(40px); -moz-transform: translateZ(40px);"> <div class="barfront" style="height: 40px;"></div> <div class="barback" style="height: 40px;"></div> <div class="barright" style="width: 40px;"></div> <div class="barleft" style="width: 40px;"></div> 10 </div> </div> </div>在上面的代码中,您可以看到突出显示设置图表中条形图的x位置的代码以及每个条形图的高度(需要为构成条形图的每个元素定义)。在那里我们应用的颜色(红色,蓝色,黄色)略微透明。
4、最终结果
如果您使用的是WebKit浏览器(Safari,Chrome,iPhone,iPad),那么您应该看到3D条形图以及一些可用于修改某些值的滑块。在Firefox中,条形图有一些人工制品,滑块呈现为普通输入框,但仍然有效。
说明:
可以通过修改.bar盒子的数值来实现条形柱的高度变化,例:
<div class="bar" style="left: 120px; background: rgba(0,127,255,0.8); -webkit-transform: translateZ(180px); -moz-transform: translateZ(120px);"> <div class="barfront" style="height: 180px;"></div> <div class="barback" style="height: 180px;"></div> <div class="barright" style="width: 180px;"></div> <div class="barleft" style="width: 180px;"></div> 30 </div>修改#stage盒子与#chart盒子里的值,可以透过不同的角度观看条形图
#stage { -webkit-perspective: 1200px; -webkit-perspective-origin: 60% 0%; -moz-perspective: 1200px; -moz-perspective-origin: 60% 0%; background: rgba(0, 255, 255, 0.2); }#chart { -webkit-transform-origin: 50% 50%; -webkit-transform: rotateX(22deg); -webkit-transform-style: preserve-3d; -moz-transform-origin: 50% 50%; -moz-transform: rotateX(22deg); -moz-transform-style: preserve-3d; }总结:以上就是本篇文的全部内容,希望能对大家的学习有所帮助。
以上就是css如何创建3D立体的条形图?创建3D立体的条形图的示例的详细内容,更多请关注php中文网其它相关文章!
网站建设是一个广义的术语,涵盖了许多不同的技能和学科中所使用的生产和维护的网站。……